Flowcharts and Algorithms:
Flowcharts:
Flowchart is a diagrametic representation of how a problem is solved. It is a pictorial view of what are the inputs, how is the process flow and what are the results after we succeed in solving the problem.
Since problems can be categerised into any of the following three types, flowcharts are also designed differently:
- Sequential Flowcharts
- Decisional Flowcharts
- Iterative Flowcharts
Sequential Flowcharts:
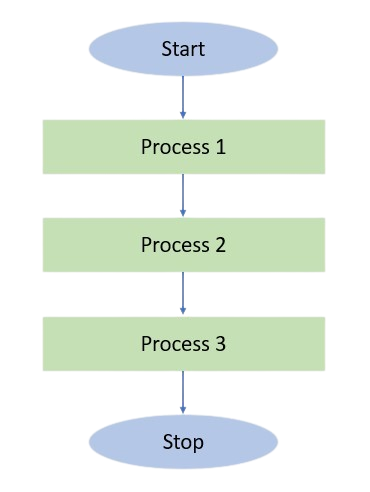
Sequential flowcharts are designed for the problem that needs a straight forward linear process flow. All that we need to do is a continuous calculation. Every single process in this flowchart represents a piece of calculation.
A great example of this flowchart would be calculating simple interest.

Decisional Flowcharts:
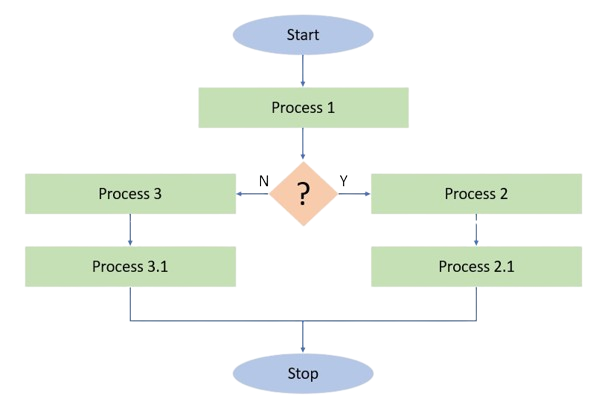
Dicisional flowcharts are designed for the problem that requires two or more different solutions based on different conditions. Flowcharts of this kind start with a linear flow but there comes a condition at some point. NOw as per the condition, process flow gets divided into two or more process flows.
Best example of this flowchart is checking whether a number is EVEN or ODD.

Iterative Flowcharts:
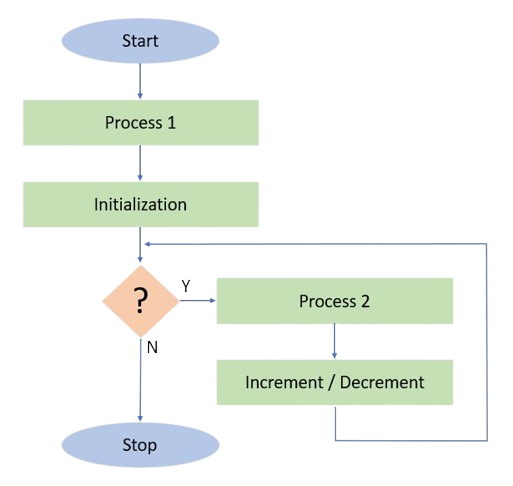
Iteration refers to the process flow where a certain set of processes keep on repeating till a condition is TRUE. Iterative flowcharts are designed for the problem that have this kind of process flow. A Liner flow starts but there comes an initialization step followed by a condition. Now based on the TRUE state of the condition, a set of processes continue including an Increment / Decrement statement. This flow comes back to the condition again as it all had to repeat till the condition remains TRUE. It's only when the condition goes FALSE that the flowchart comes to the end.
Best example of this flowchart is printing counting sequences or tables.

Algorithms:
Algorithm is a typical text representation of how to solve a problem. Since it is all text, it needs to be in clear-cut steps. It also needs to be in structured english.
Following are some examples of algorithms written for different problems.
Algorithm to calculate simple interest.
- Find Principal Ammount and keep in variable [pr_amt].
- Find Rate of Interest and keep in variable [int_rt].
- Find Time and keep in variable [time].
- Multiply [pr_amt], [int_rt], [time] and keep the product in variable [product].
- Divide [product] by 100 and keep the result in variable [simple_interest].
- End of Algorithm
Algorithm to check whether a number is EVEN or ODD.
- Find the number and keep in variable [num].
- Divide [num] by 2 and keep the result in variable [quotient]
- If the value in [quotient] is 0, go to Step 5.
- Else If the value in [quotient] is 1, go to Step 6.
- [num] is EVEN.
- [num] is ODD.
- End of Algorithm
Algorithm to print counting sequence from 1 to 10.
- Keep 1 in variable [num].
- If [num] is less than or equal to 10, go to Step 4.
- Else, go to Step 6.
- Print the value of [num].
- Increment [num] by 1 and go to Step 2.
- End of Algorithm